The great thing about volatility is that you can make a lot of money on it. Price does strong movements, so your profit can increase significantly. However, there’s no such thing as a free lunch. High profit always brings high risks. We gathered the most important tips which will help you avoid falling into a trap.
We decided to divide our tutorial into 2 parts: the things you should
and shouldn’t do. Let us start with things you should do when the
market is highly volatile.
Widen take profit/stop loss
There are different types of volatility. So, your trading strategies should be different as well.
Imagine you want to have a longer-term trade. During this period, the price may go up and down several times. If you set a small take profit/stop loss, there will be a high probability that the fast-moving price will hit it too rapidly thus preventing you from getting bigger gains. As a result, it’s logical that you should widen your take profit and stop loss orders to stay in the market for longer.
Note: During the times of high volatility, you will see your profit on an open position making sharp increases and decreases. It’s important to not panic, choose targets wisely and wait until the price reaches them.
Cut losses
In the previous passage, we explained that to survive high volatility for some time you need wider stops. However, you trading goals may be different.
Imagine the price has gone in active motion but you are not sure about its further movement. Maybe it will go down and then up again, maybe it will go down and won’t come back. As a result, you don’t want to risk but at the same time, you don’t want to miss a great trading opportunity. If you want to catch a particular price swing, put a stop loss near the price. If the market won’t go in the direction you thought it would, it won’t hurt you much. If it does, lucky you, you will catch a movement and earn more because of higher volatility.
Do you now see the difference between a wide stop loss and a tight stop loss scenario? Your strategy defines your actions!
Trade on the break
Resistance and support levels are key for traders. A trader uses them to determine entry, reversal and exit points. In times of volatility, these levels become even more important because their break can cause an extremely big price movement in the direction of a breakthrough.
The market is in a panic but you shouldn’t be. You can follow the break when other traders are in a panic. This is a risky bet: during a chaotic market a break may be false, and the price may turn back. Yet, if a break is not false, you will have a great profit. Taking into account the fact that you are making an ambitious and risky bet, you can allow yourself to have a bigger take profit. The stop loss should be small. Once the market moves in your favor, you can move your stop loss to a breakeven point and then let it trail after the price.
Diversify portfolio
The key to the profitable trading is diversification. You can never be sure about the price. Therefore, it’s worth diversifying your investments. If you lose something in one trading, there is a high possibility that you will get a profit in another one.
In times of high volatility, this rule works the best as uncertainties increase. It not very likely that all pairs will become incredibly volatile at the same time. So, invest in pairs that are not correlated. In case you suffer losses because of the high volatility, you can smooth them with profit on other pairs.

Let’s now have a look at the things you shouldn’t do.
Don't dwell on the needless
Technical indicators help traders a lot. They can define the key levels, determine the future direction of the price, give clues on the trend, etc. However, they are good while trading is smooth. In times of high volatility, they can cheat on you. When the market is shocked with an event and a great movement happens, no indicator can predict it or react to such a shock immediately. As a result, it’s better to clear your chart from indicators.
The one indicator which may help you predict a spike in volatility is called Bollinger bands. The idea of this indicator is very simple. When you see that 3 indicator’s lines narrow, it’s a signal of the upcoming spike of the price.
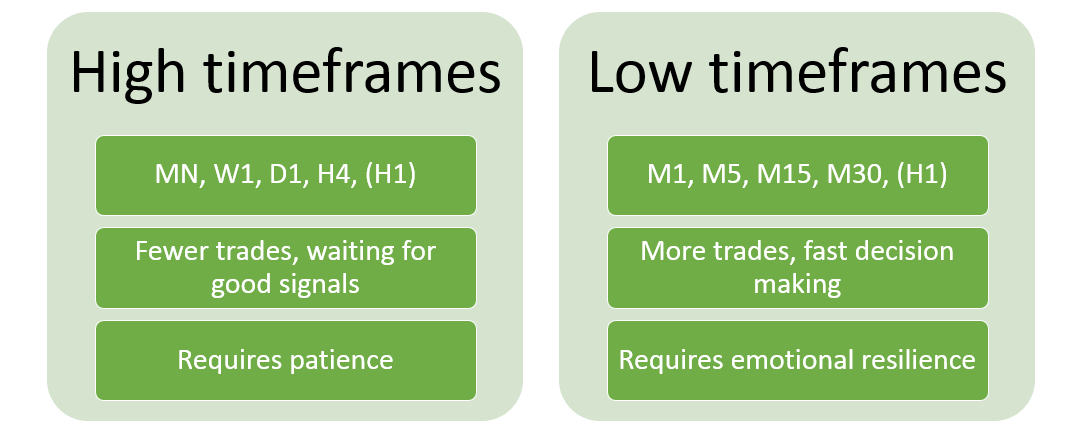
Here another important thing should be added. It is “look wider”. Never consider small timeframes while trading high volatility. In times of high volatility, the market is too active. The direction on small timeframes can change several times in a short period. As a result, you will be confused, and risks of the losses will significantly increase. Take into consideration larger timeframes. The picture will become clearer and you will understand the situation better.
Don’t hurry up
In times of high volatility, it’s easy to panic and start doing crazy things. Never do that. The panic will only worsen the situation.
Remember the main rule: you are never able to turn the direction of the price.
If you see that the price goes up/down extremely fast, don’t try to pick tops and bottoms. You will never be able to determine them accurately. All you need to do is to set stop losses and take profit wisely. As a result, you will be able to increase your profit, but even if the trading is not successful, you will be able to cut your losses.
Making a conclusion, we can say that trading on high volatility is an interesting thing. It’s a key to a big profit; however, it carries high risks as well. That’s why only advanced traders will be able to get through it with success. If you want to trade on high volatility, you should firstly improve your skills. Check our guidebook to become a professional trader!

Widen take profit/stop loss
There are different types of volatility. So, your trading strategies should be different as well.
Imagine you want to have a longer-term trade. During this period, the price may go up and down several times. If you set a small take profit/stop loss, there will be a high probability that the fast-moving price will hit it too rapidly thus preventing you from getting bigger gains. As a result, it’s logical that you should widen your take profit and stop loss orders to stay in the market for longer.
Note: During the times of high volatility, you will see your profit on an open position making sharp increases and decreases. It’s important to not panic, choose targets wisely and wait until the price reaches them.
Cut losses
In the previous passage, we explained that to survive high volatility for some time you need wider stops. However, you trading goals may be different.
Imagine the price has gone in active motion but you are not sure about its further movement. Maybe it will go down and then up again, maybe it will go down and won’t come back. As a result, you don’t want to risk but at the same time, you don’t want to miss a great trading opportunity. If you want to catch a particular price swing, put a stop loss near the price. If the market won’t go in the direction you thought it would, it won’t hurt you much. If it does, lucky you, you will catch a movement and earn more because of higher volatility.
Do you now see the difference between a wide stop loss and a tight stop loss scenario? Your strategy defines your actions!
Trade on the break
Resistance and support levels are key for traders. A trader uses them to determine entry, reversal and exit points. In times of volatility, these levels become even more important because their break can cause an extremely big price movement in the direction of a breakthrough.
The market is in a panic but you shouldn’t be. You can follow the break when other traders are in a panic. This is a risky bet: during a chaotic market a break may be false, and the price may turn back. Yet, if a break is not false, you will have a great profit. Taking into account the fact that you are making an ambitious and risky bet, you can allow yourself to have a bigger take profit. The stop loss should be small. Once the market moves in your favor, you can move your stop loss to a breakeven point and then let it trail after the price.
Diversify portfolio
The key to the profitable trading is diversification. You can never be sure about the price. Therefore, it’s worth diversifying your investments. If you lose something in one trading, there is a high possibility that you will get a profit in another one.
In times of high volatility, this rule works the best as uncertainties increase. It not very likely that all pairs will become incredibly volatile at the same time. So, invest in pairs that are not correlated. In case you suffer losses because of the high volatility, you can smooth them with profit on other pairs.

Let’s now have a look at the things you shouldn’t do.
Don't dwell on the needless
Technical indicators help traders a lot. They can define the key levels, determine the future direction of the price, give clues on the trend, etc. However, they are good while trading is smooth. In times of high volatility, they can cheat on you. When the market is shocked with an event and a great movement happens, no indicator can predict it or react to such a shock immediately. As a result, it’s better to clear your chart from indicators.
The one indicator which may help you predict a spike in volatility is called Bollinger bands. The idea of this indicator is very simple. When you see that 3 indicator’s lines narrow, it’s a signal of the upcoming spike of the price.
Here another important thing should be added. It is “look wider”. Never consider small timeframes while trading high volatility. In times of high volatility, the market is too active. The direction on small timeframes can change several times in a short period. As a result, you will be confused, and risks of the losses will significantly increase. Take into consideration larger timeframes. The picture will become clearer and you will understand the situation better.
Don’t hurry up
In times of high volatility, it’s easy to panic and start doing crazy things. Never do that. The panic will only worsen the situation.
Remember the main rule: you are never able to turn the direction of the price.
If you see that the price goes up/down extremely fast, don’t try to pick tops and bottoms. You will never be able to determine them accurately. All you need to do is to set stop losses and take profit wisely. As a result, you will be able to increase your profit, but even if the trading is not successful, you will be able to cut your losses.
Making a conclusion, we can say that trading on high volatility is an interesting thing. It’s a key to a big profit; however, it carries high risks as well. That’s why only advanced traders will be able to get through it with success. If you want to trade on high volatility, you should firstly improve your skills. Check our guidebook to become a professional trader!
- Build your own people-based portfolio to trade for you
- Get a FREE demo account and see how CopyTrading works
- Trade safely with eToro’s responsible trading
- 24/7 support by phone or live chat
- Tight spreads and no commissions


